The world of eCommerce is pretty confusing and complex when you don’t know the right things to focus on!
However, with the right piece of information and a deep understanding of your business’s KPIs, eCommerce is a smooth and fulfilling journey. One of the most essential parts that can help you understand and optimize your eCommerce business is analytics.
Data is the present and future of businesses, but when you start analyzing your data, it is pretty common to get confused and overwhelmed with loads and loads of data points.
This article shares the most crucial eCommerce analytics that will help you optimize and grow your business. We will help you focus on the most critical analytics that is aligned to the growth of your business and can help you fix key performing areas.
Without any further ado, let’s jump straight into the analytics:
Segmented Conversion Rate
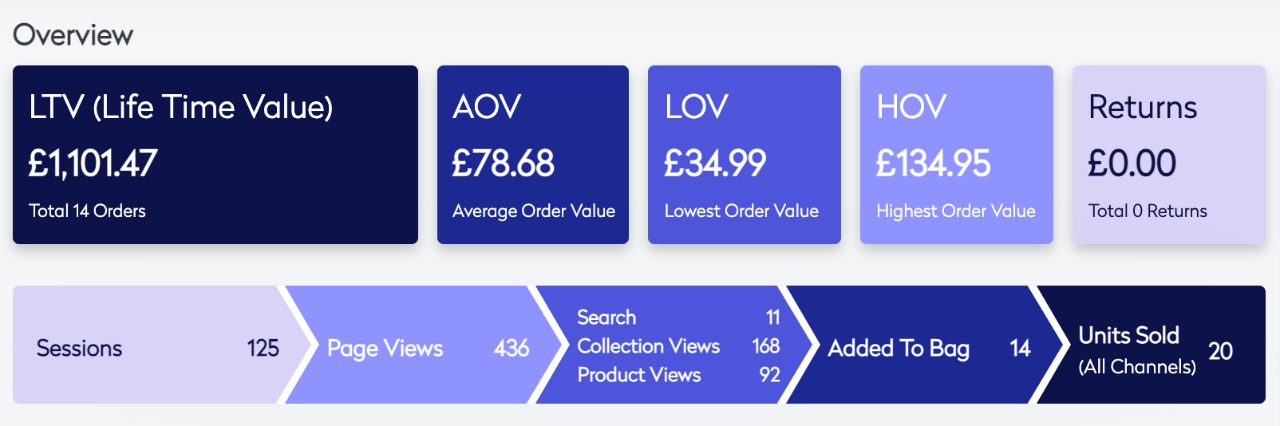
The conversion rate of customers is a clear-cut metric. It is the percent of visitors who visit your online store to make purchases. The conversion rate is the number of buyers who purchase from your store divided by the number of visitors your store lists. For instance, if your website has 150 visitors and 14 visitors out of them, make a purchase. The conversion rate is 9.3% (14 divided by 150).
The conversion rate is one of the most important eCommerce analytics to measure the success of your online store, but there is more to it. You can break down and segment the conversion rate of your store and get insights into the data. These insights can help you work with the individual campaigns that help you improve your store. Some ways to segment the conversion rate of your online store are listed below. Let us take a look.
Conversion of visitors by traffic source:- If you review how buyers convert based on traffic sources like Facebook, Google, Reddit, etc., you can decide which traffic source you should be targeting.
Conversion by the kind of device:- $2.3 Trillion worth of transactions were made from mobile phones in 2019 and it is expected to cross $3.5 Trillion in 2021. Traffic driven from mobile phones is very high. They account for more than half of e-commerce traffic. You can review your user experience and make changes to boost improvements.
Conversion of fresh vs old returning visitors:- Conversions of your old customers are always higher as they trust your brand and like your services. They keep coming back to make further purchases. For instance, if your new visitors convert at 2% and returning visitors convert at 7%, the average falls at 5%. If you use this average to estimate the budget for acquisition campaigns, you are likely to lose money. Segmenting conversions can help you spend wisely on acquisition campaigns and their performance.
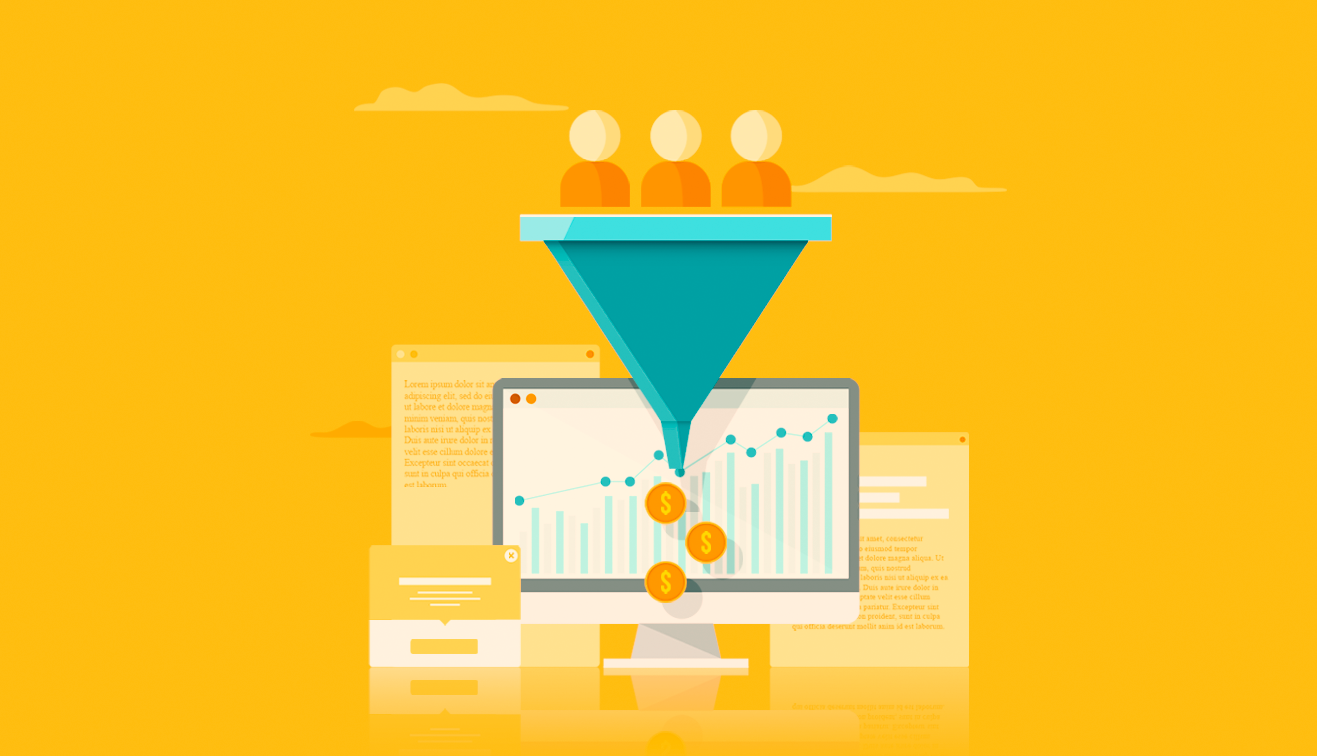
Segmented Revenue
Segmented revenue is the next point listed in the most important eCommerce analytics list. The way you segment your conversions, you should segment your revenue. The segmented revenue helps to track your visitor conversions by traffic. You can get to know of websites that are bringing in the most traffic and conversions. This way you can prioritize your efforts and focus on the areas that are bringing the most results.
Some such sources include:
- organic search
- traffic from social or blogs
- Email campaigns
Segmenting revenue allows you to have an insight into how your buyers spend from each source of traffic. For instance, conversions from Facebook might be higher, but the buyer purchases products just once. On the other hand, conversions from email campaigns might be low but the average order value is generally higher.
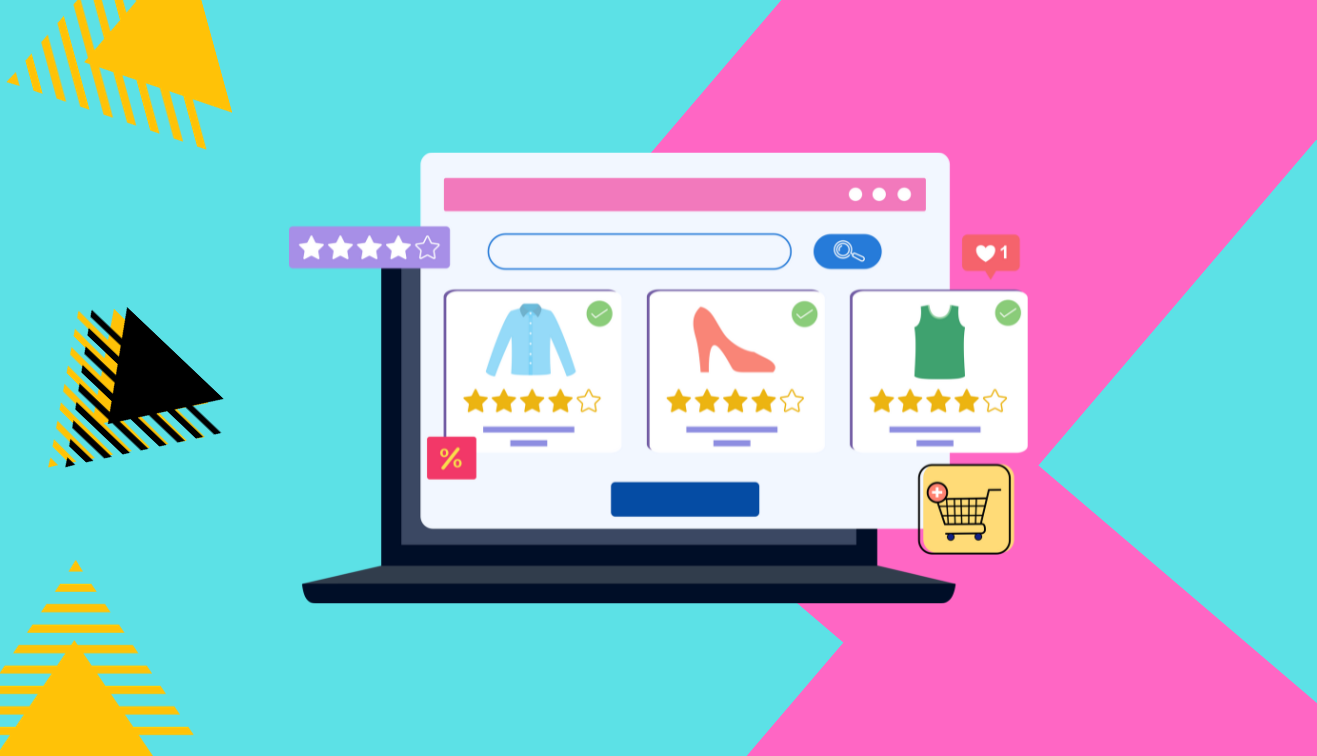
Conversion by Product
If your online store lists plenty of products and a large inventory, conversion by the products you sell is one of the most important eCommerce analytics. This metric helps you to track how your products individually perform when you compare the individual product conversions. Not just this, you can also spot the underperforming products as well as the trending ones. Looking at the data, you can make changes and strategic adjustments.
Funnel Abandonment
Another addition to the list of the most important eCommerce analytics is cart abandonment. Online stores commonly track abandoned carts of visitors. Several e-commerce platforms offer in-built responders to gain back abandoned carts. To get an insight on where the customers are dropping out of the purchasing process, you can check it manually by tracking the flow of visitors on your online store.
Returning Buyers
The percentage of returning buyers is one of the most important eCommerce analytics to measure the loyalty of your buyers and how the returning visits change to revenue. Therefore, you must check the returning percentage of customers as they are the ones who come to spend money. Several e-commerce platforms offer detailed reports on returning customers. Returning buyers let you know the critical information like:
- pricing
- customer service
- trust
- buyer sentiments
Returning visitors are very profitable as you do not require to pay acquisition costs to have them back. If your customer return rates drop, you need to check the overall customer experience and rectify the loopholes that keep your customers from returning. Also, returning customers are not just about earning revenue. The customers who shop with you are the ones who take time to leave reviews on your store. Studies show that 55% of buyers state that reading reviews of products help them in decision making while planning to make a purchase.
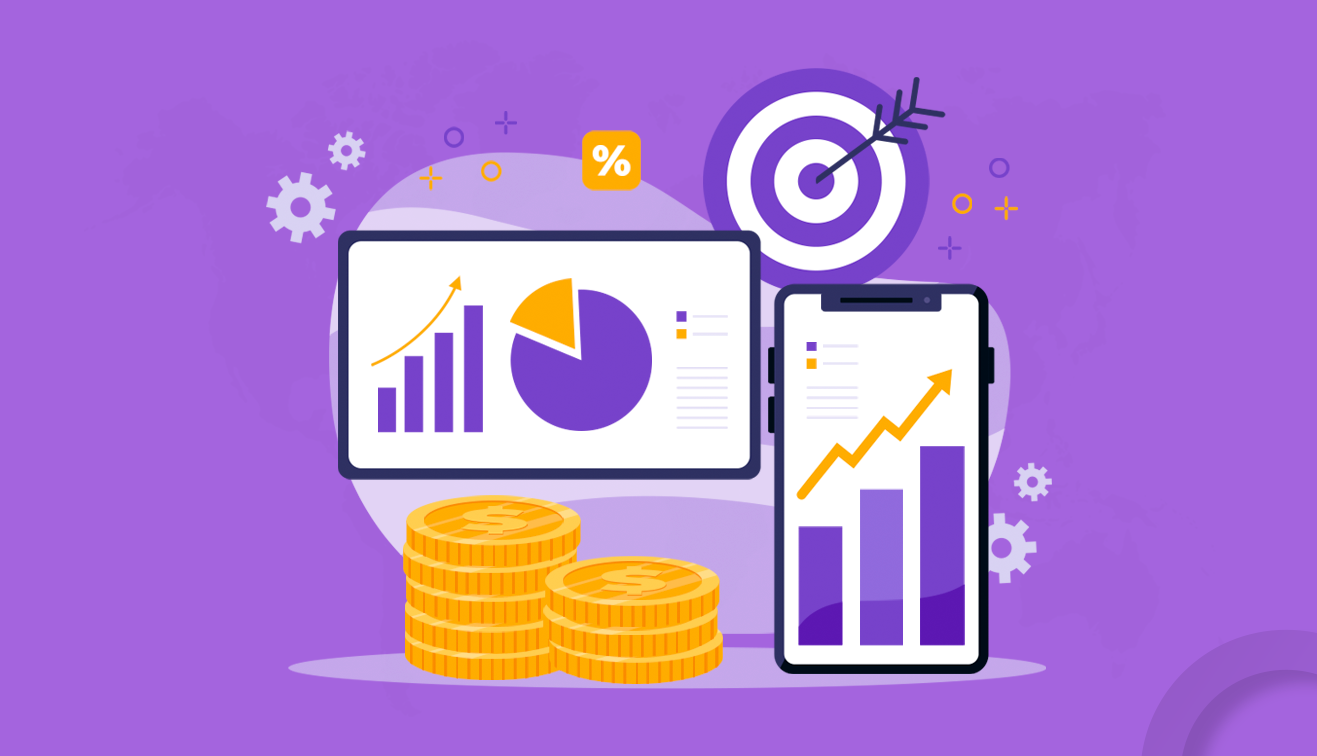
Average Order Value
The average order value is the ratio of the sum of the price of all orders to the total number of orders. For instance, if you track the sales of a month and the number of orders is 760 with a total price of 25,000 GBP, the AOV is 25,000 GBP divided by 760. Therefore, the average order value equals 32.89 GBP. When you know the AOV helps you realize the value of your buyers and align better strategies for development and growth.
The Lifetime Value of the Buyer
The customer lifetime value is undoubtedly one of the most important eCommerce analytics to analyze in e-commerce. It is the overall revenue that you anticipate a buyer to bring in a lifetime or for as long as they are your customer. You can calculate the AOV of your customer and get insights on variables like frequency, choices, and others. Several e-commerce platforms offer you resources to track reports on your topmost customers and their lifetime value.
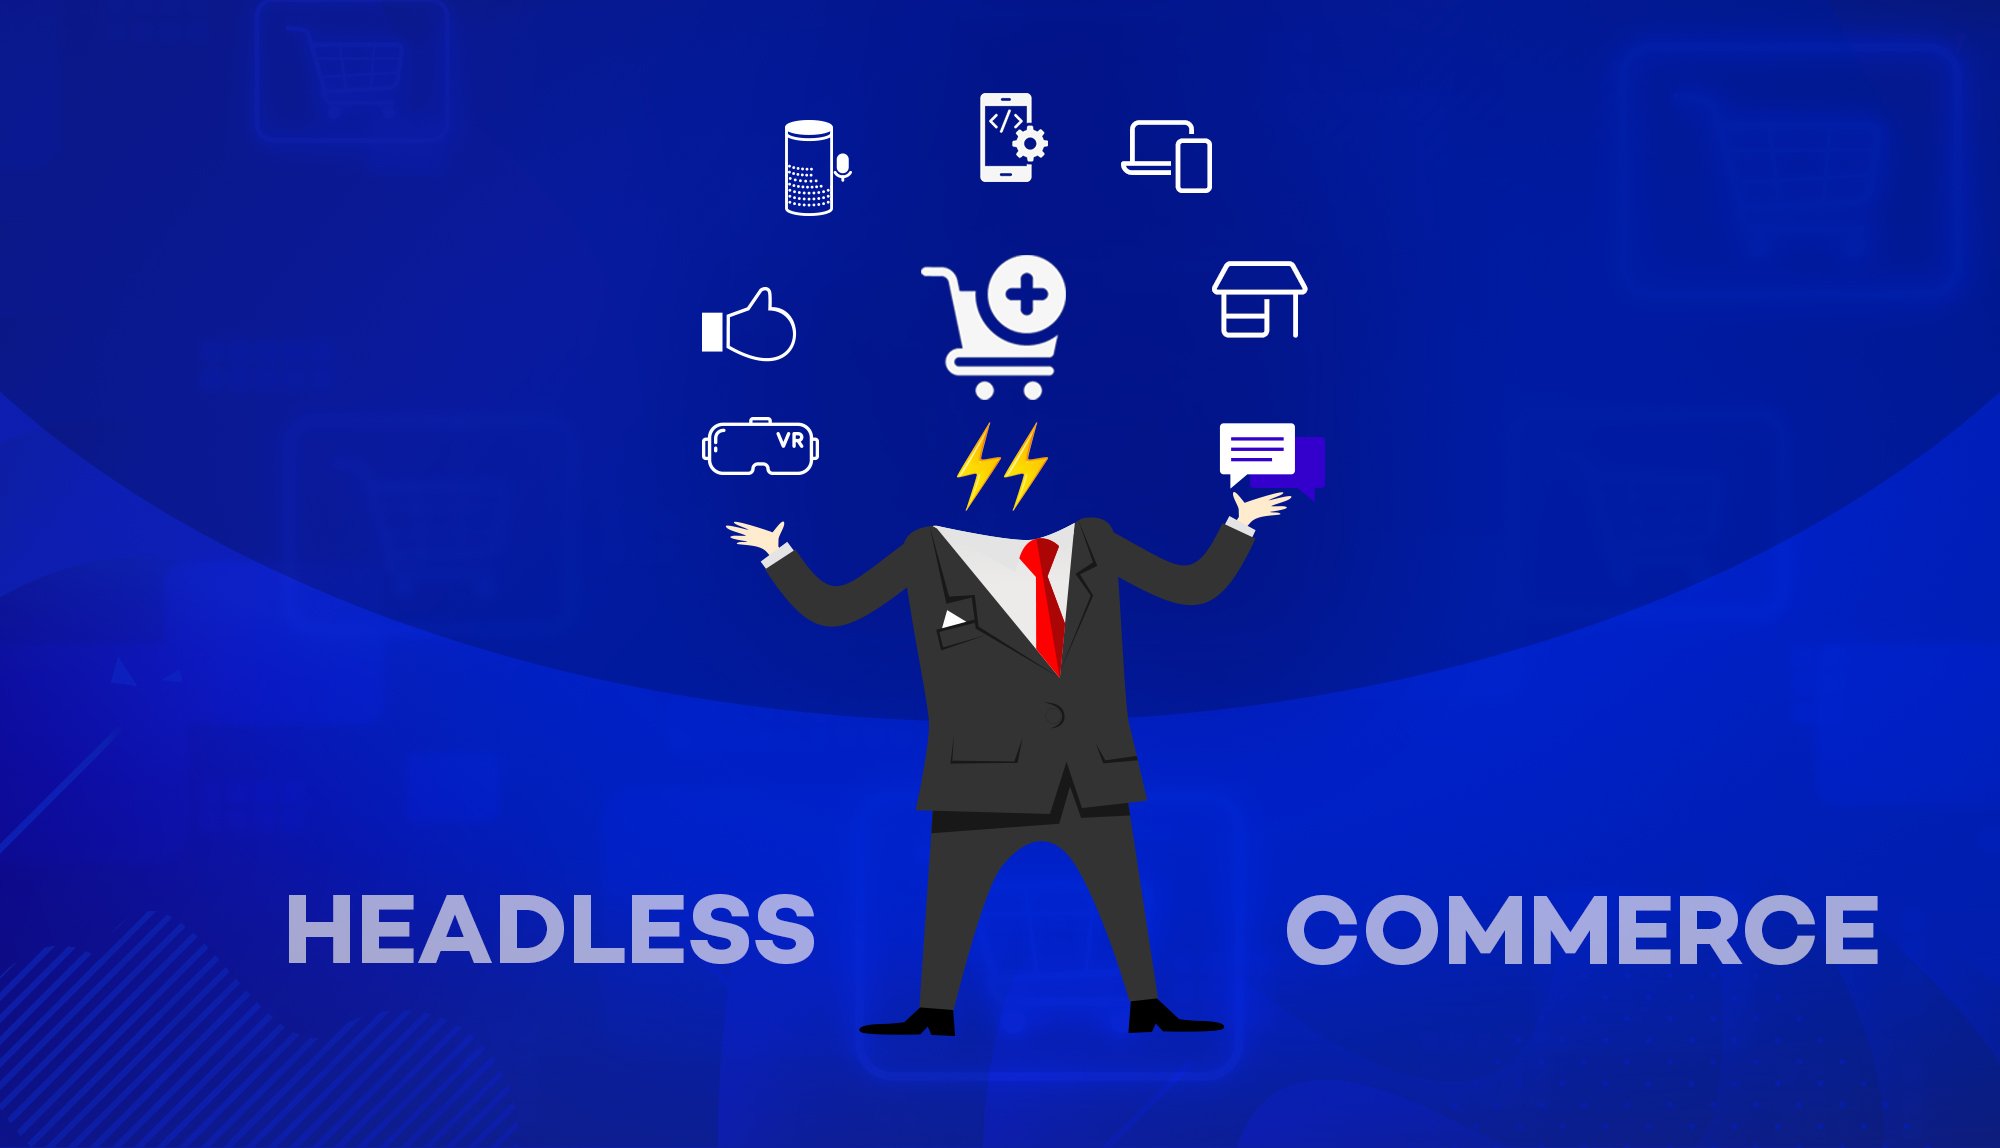
If you are confused about which e-commerce platform would be appropriate for your online venture, you can do some research on 8 things you should know before choosing a headless eCommerce platform and get some clarity on where to invest. With a thorough read, you can get clarity on where to spend and launch your online store.
Conclusion
You are now a lot of steps further in your eCommerce analytics journey.
Make sure to create a sheet of the analytics and have a system in place that will help you track all these numbers.
Ideally, your eCommerce platform should allow you to track most of the analytics within the software. If your software is not analytics heavy or if you are looking for a better solution, check out BetterCommerce!
We have integrated most of the critical analytics for eCommerce stores and allow them to access data and grow their business with the insights they get from that data.
What are you waiting for? Start by creating your analytics strategy now!


.jpg?w=3840&q=75)


.png?w=3840&q=75)


.jpg?w=3840&q=75)


.jpg?w=3840&q=75)


.png?w=3840&q=75)


.png?w=3840&q=75)

.jpg?w=3840&q=75)


 copy.png?w=3840&q=75)
.png?w=3840&q=75)


_ Why do you need one.png?w=3840&q=75)